Spec-Zone .ru
спецификации, руководства, описания, API
|
|
Spec-Zone .ru
спецификации, руководства, описания, API
|
The stored procedure debugger, new in Connector/Net 6.6, provides facilities for setting breakpoints, stepping into individual statements (Step Into, Step Out, Step Over), evaluating and changing local variable values, evaluating breakpoints, and other typical debugging tasks.
To enable the stored procedure debugger, install Connector/Net 6.6 or higher and choose the Complete option.
The debugger recreates at the start of each debug session a serversidedebugger
database in your server. This database helps to track the instrumented code and implement observability logic in
the debugged routine. Your current connection needs to have privileges to create that database, and its
associated stored routines, functions, and tables.
The debugger makes changes behind the scenes to temporarily add instrumentation code to the stored routines that
you debug. You must have the ALTER ROUTINE privilege for each stored procedure,
function, or trigger that you debug. (Including procedures and functions that are called, and triggers that are
fired, by a procedure that you are debugging.)
To start the debugger, follow these steps:
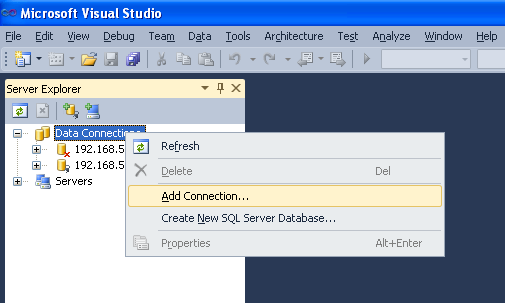
Choose a connection in the Visual Studio Server Explorer.
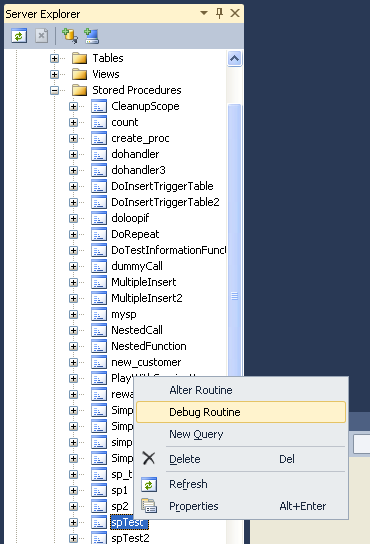
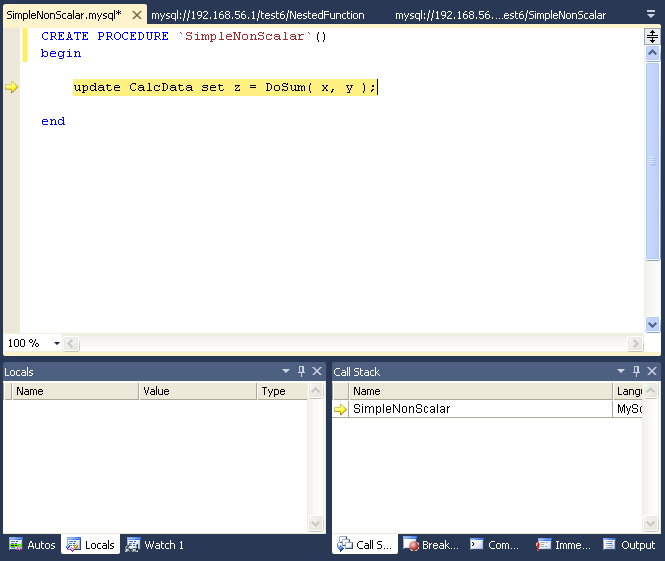
Expand the Stored Procedures folder. Only stored
procedures can be debugged directly. To debug a user-defined function, create a stored procedure that
calls the function.
Click on a stored procedure node, then right-click and from the context menu choose Debug Routine.
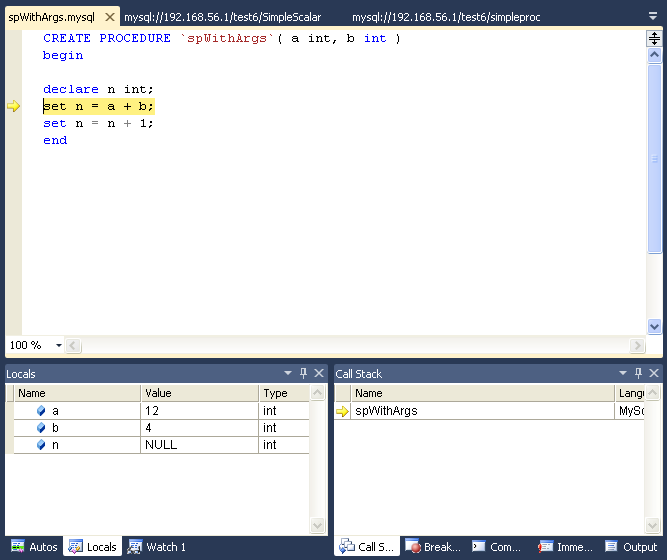
At this point, Visual Studio switches to debug mode, opening the source code of the routine being debugged in step mode, positioned on the first statement.
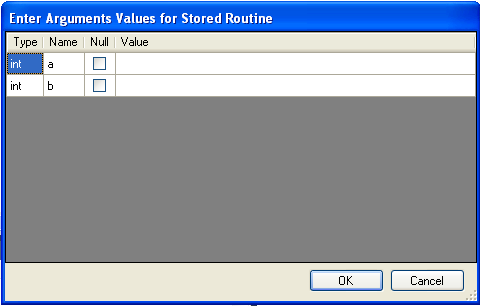
If the initial routine you debug has one or more arguments, a popup will show up with a grid (a row per each argument and three columns: one for the argument, one for the argument value (this is editable) and one for nullifying that argument value (a checkbox)). After setting up all the argument values, you can press OK to start the debug session, or Cancel to cancel the debug session.
To have visibility into the internal workings of a stored routine, the debugger prepares a special version of the procedure, function, or trigger being debugged, instrumented with extra code to keep track of the current line being stepped into and the values of all the local variables. Any other stored procedures, functions, or triggers called from the routine being debugged are instrumented the same way. The debug versions of the routines are prepared for you automatically, and when the debug session ends (by either pressing F5 or Shift+F5), the original versions of the routines are automatically restored.
A copy of the original version of each instrumented routine (the version without instrumentation) is stored in
the AppData\Roaming\MySqlDebuggerCache folder for the current Windows user (the
path returned by calling System.Environment.GetFolderPath(Environment.SpecialFolder.ApplicationData)
in .NET, plus appending MySqlDebuggerCache. There is one file for each instrumented
routine, named routine_name.mysqlfergs, the path is C:\Users\fergs\AppData\Roaming\MySqlDebuggerCache.
Two threads are used, one for the debugger and one for the routine being debugged. The threads run in strict alternation, switching between the debugger and the routine as each statement is executed in the stored routine.
The debugger has the same look and feel as the standard Visual Studio debuggers for C#, VB.NET or C++. In particular, the following are true:
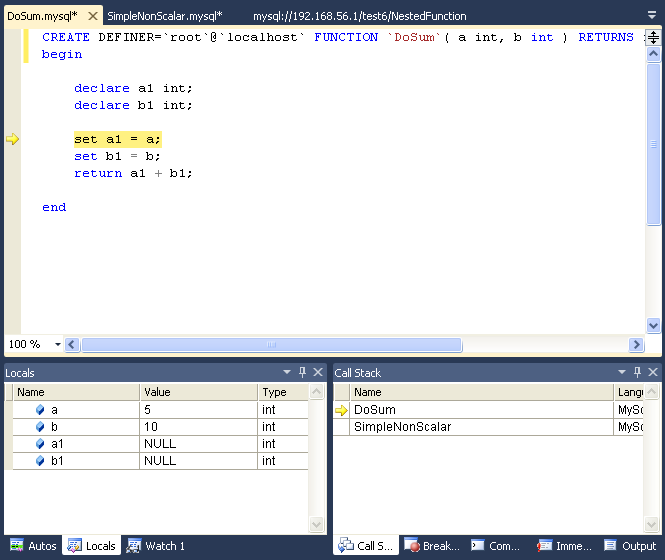
Locals and Watches
To show the Locals tab, choose the menu item Debug -> Windows -> Locals.
The Locals tab lists all the variables available in the current scope:
variables defined with DECLARE at any point in the routine, argument
parameters, and session variables that are referenced.
If the last step operation changes the value of a local, its value will be highlighted in red (until another statement is executed or stepped.
You can change the value of any local.
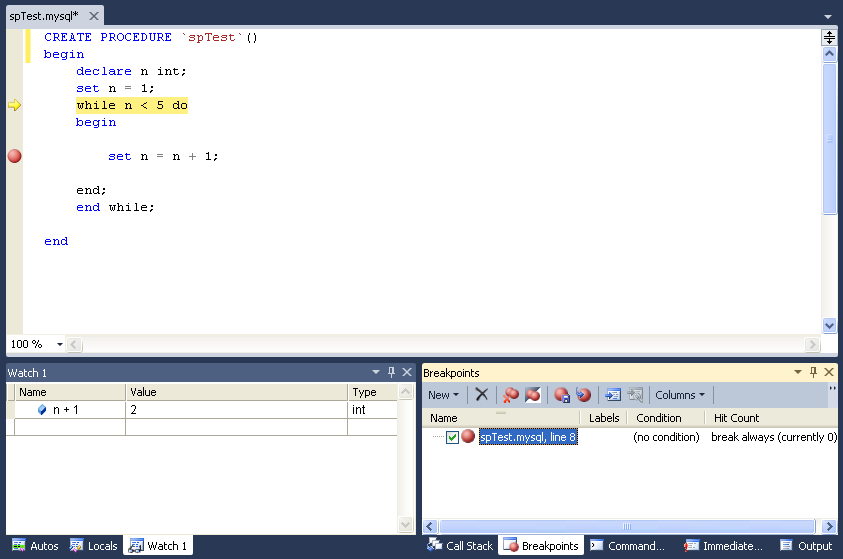
To show the Watch tab, choose the menu item Debug -> Windows -> Watch.
To define a watch, type any valid MySQL expression, optionally including function calls. If the watch evaluation makes sense in the current context (current stack frame), it will show its value, otherwise it will show an error message in the same row the watch was defined.
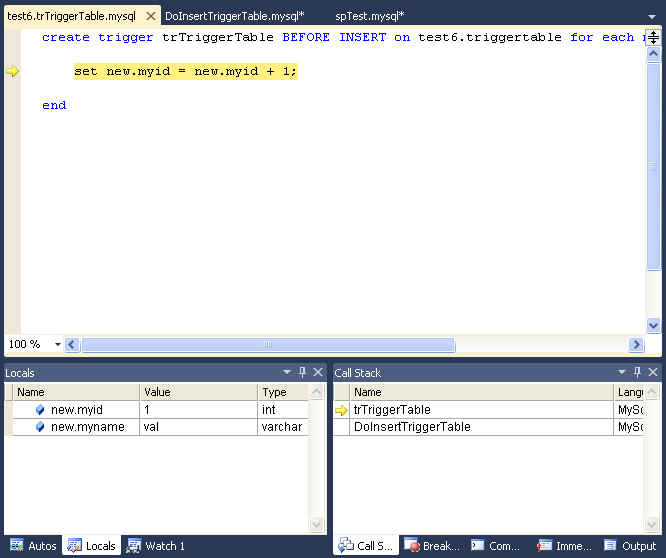
When debugging a trigger, in addition to any locals declared or session variables
referenced, the new and old object (when applicable) will be listed. For example in a trigger for INSERT, for a table defined like:
create table t1( id int, myname varchar( 50 ));
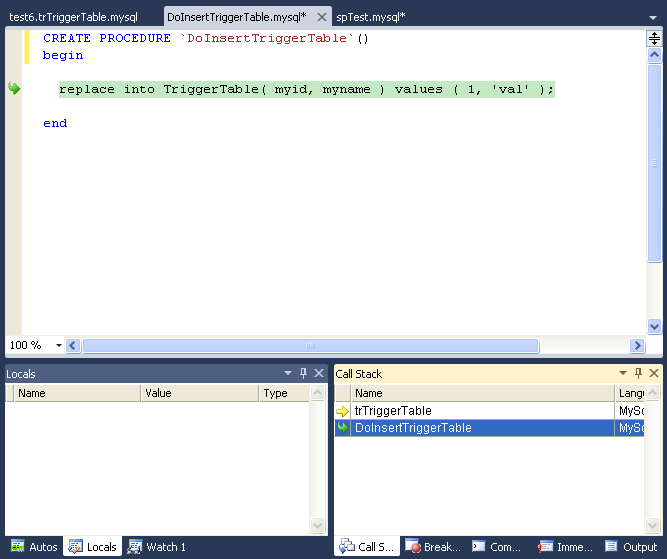
Call Stack
To show the Call Stack tab, choose the menu item Debug -> Windows -> Call Stack.
The stack trace (in the Call Stack tab) will list all the stack traces, one for each routine invocation. The one with a yellow mark is the current stepping point. Clicking in another will activate in the editor the tab for that routine source, highlighting in green the last statement stepped.
Stepping
Stepping of a new routine starts in the first executable instruction (excluding declares, handlers, cursor declarations, and so on).
To step into the code of a condition handler, the condition must be triggered in the rest of the MySQL routine.
The next statement to be executed is highlighted in yellow.
To continue stepping, you can choose between Step Into (by pressing F11), Step Out (by pressing F10) or Step Over (by pressing Shift+F11).
You can step out of any of functions, triggers or stored procedures. If you step from the main routine, it will run that routine to completion and finish the debug session.
You can step over stored procedure calls, stored functions, and triggers. (To step over a trigger, step over the statement that would cause the trigger to fire.)
When stepping into a single statement, the debugger will step into each individual function invoked by that statement and each trigger fired by that statement. The order in which they are debugged is the same order in which the MySQL server executes them.
You can step into triggers triggered from INSERT, DELETE, UPDATE, and REPLACE
statements.
Also, the number of times you enter into a stored function or trigger depends on
how many rows are evaluated by the function or affected by the trigger. For example, if you press F11 (Step Into) into an
UPDATE statement that modifies three rows (calling a function for a column
in the SET clause, thus invoking the function for each of the three rows),
you will step into into that function three times in succession, once for each of the rows. You can
accelerate this debug session by disabling any breakpoints defined in the given stored function and
pressing Shift+F11 to step out. In this example, the order
in which the different instances of the stored function are debugged is server-specific: the same order
used by the current MySQL server instance to evaluate the three function invocations.
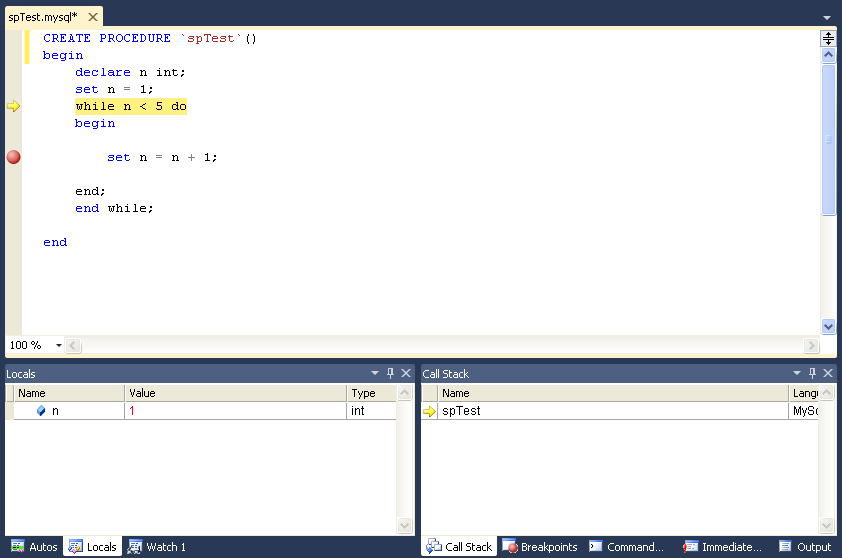
Breakpoints
To show the Breakpoints tab, choose the menu item Debug -> Windows -> Breakpoints.
The Breakpoints tab will show all the breakpoints defined. From here, you can enable and disable breakpoints one by one or all at once (using the toolbar on top of the Breakpoints tab).
You can define new breakpoints only in the middle of a debug session. Click in the left gray border of any MySQL editor, or click anywhere in a MySQL editor and press F9. In the familiar Visual Studio way, you press F9 once to create a breakpoint in that line, and press it again to remove that breakpoint.
Once a breakpoint is defined, it will appear enabled (as filled red circle left to the current row if that line is a valid statement to put a breakpoint) or disabled (as a non-filled red circle left to the current row if that row is not valid to put a breakpoint).
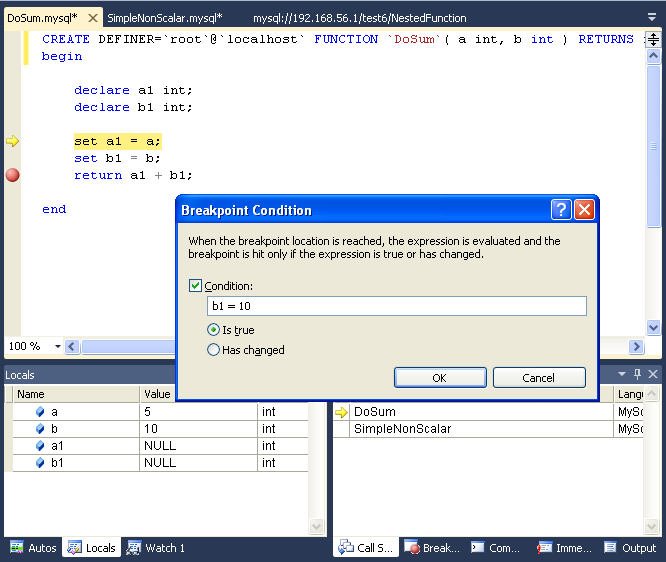
To define conditional breakpoints, after creating the breakpoint, right click in the red dot and choose Condition.... There you can put any valid MySQL expression and state if the condition is Is True or Has changed. The former will trigger the breakpoint every time the condition is true, the latter every time the condition value has changed. (If you define a conditional breakpoint, it is not enough to step into the line with the breakpoint defined to trigger such a breakpoint.)
To define pass count breakpoints, after creating the breakpoint, right click in the red dot and choose Hit Count.... In the popup dialog, define the specific condition to set. For example, break when the hit count is equal to and a value 3 will trigger the breakpoint the third time it is hit.
To abort the debug session (and the execution of the current call stack of routines), press Shift+F5.
To run the routine to completion (or until next breakpoint hit), press F5.
For all functionality you can use (in addition to the shortcuts documented), see the options in the Debug menu of Visual Studio.
Code being debugged must not use get_lock or release_lock MySQL functions, since they are used internally by the debugger
infrastructure to synchronize the debugger and the debugged routine.
Code being debugged must avoid using any transaction code (START
TRANSACTION, COMMIT, ROLLBACK) due to
the possibility of wiping out the contents of the debugger tables. (This limitation may be removed in
the future).
You cannot debug the routines in the serversidedebugger database.
The MySQL server running the routine being debugged can be any version between 5.0 and 5.6, running on Windows, Linux, or any other supported platform.
We recommend always running debug sessions on test and development servers, rather than against a MySQL production server, because debugging can cause temporary performance issues or even deadlocks. The instrumented versions of the routines being debugged use locks, that the rest of the production code may not be aware of.
The following list summarizes the keyboard shortcuts for debugging:
F9 Toggles breakpoints
F11: Step into once
F10: Step over once
Shift+F11: Step out once
F5: Run
Shift+F5: Abort current debug session