Примечание
Перейти в конец, чтобы скачать полный код примера или запустить этот пример в браузере через JupyterLite или Binder.
Сравнение BIRCH и MiniBatchKMeans
В этом примере сравнивается время работы BIRCH (с этапом глобальной кластеризации и без него) и MiniBatchKMeans на синтетическом наборе данных из 25 000 образцов и 2 признаков, созданном с помощью make_blobs.
И MiniBatchKMeans, и BIRCH — алгоритмы с высокой масштабируемостью, которые могут эффективно работать с сотнями тысяч и даже миллионами точек данных. Чтобы использование ресурсов непрерывной интеграции оставалось разумным, мы ограничили размер набора данных в этом примере, но заинтересованный читатель может изменить этот скрипт и запустить его с большим значением n_samples.
Если для n_clusters задано значение None, количество образцов сокращается с 25 000 до набора из 158 кластеров. Это можно рассматривать как этап предварительной обработки перед финальным (глобальным) этапом кластеризации, который дополнительно сокращает эти 158 кластеров до 100.
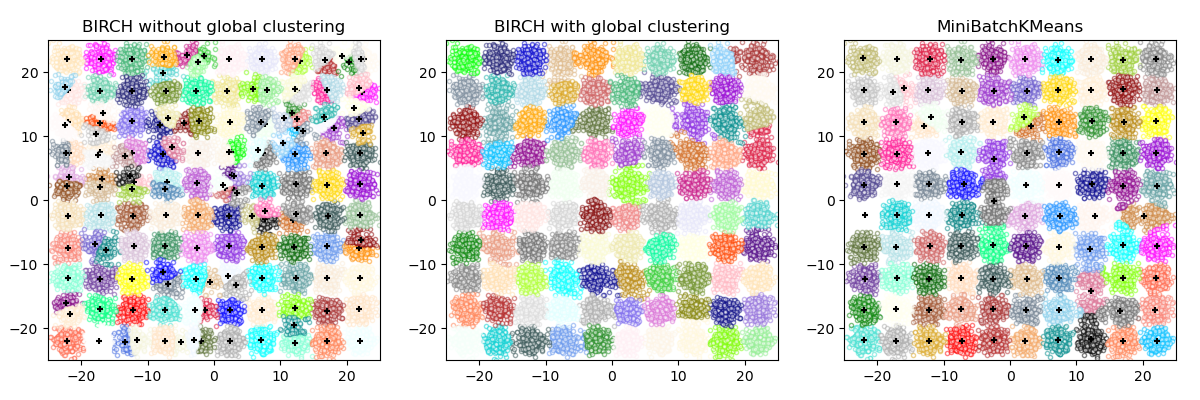
BIRCH without global clustering as the final step took 0.49 seconds
n_clusters : 158
BIRCH with global clustering as the final step took 0.49 seconds
n_clusters : 100
Time taken to run MiniBatchKMeans 0.23 seconds
# Authors: The scikit-learn developers
# SPDX-License-Identifier: BSD-3-Clause

from itertools import cycle
from time import time

import matplotlib.colors as colors
import matplotlib.pyplot as plt
import numpy as np
from joblib import cpu_count

from sklearn.cluster import Birch, MiniBatchKMeans
from sklearn.datasets import make_blobs

# Generate centers for the blobs so that it forms a 10 X 10 grid.
xx = np.linspace(-22, 22, 10)
yy = np.linspace(-22, 22, 10)
xx, yy = np.meshgrid(xx, yy)
n_centers = np.hstack((np.ravel(xx)[:, np.newaxis], np.ravel(yy)[:, np.newaxis]))

# Generate blobs to do a comparison between MiniBatchKMeans and BIRCH.
X, y = make_blobs(n_samples=25000, centers=n_centers, random_state=0)

# Use all colors that matplotlib provides by default.
colors_ = cycle(colors.cnames.keys())

fig = plt.figure(figsize=(12, 4))
fig.subplots_adjust(left=0.04, right=0.98, bottom=0.1, top=0.9)

# Compute clustering with BIRCH with and without the final clustering step
# and plot.
birch_models = [
    Birch(threshold=1.7, n_clusters=None),
    Birch(threshold=1.7, n_clusters=100),
]
final_step = ["without global clustering", "with global clustering"]

for ind, (birch_model, info) in enumerate(zip(birch_models, final_step)):
    t = time()
    birch_model.fit(X)
    print("BIRCH %s as the final step took %0.2f seconds" % (info, (time() - t)))

    # Plot result
    labels = birch_model.labels_
    centroids = birch_model.subcluster_centers_
    n_clusters = np.unique(labels).size
    print("n_clusters : %d" % n_clusters)

    ax = fig.add_subplot(1, 3, ind + 1)
    for this_centroid, k, col in zip(centroids, range(n_clusters), colors_):
        mask = labels == k
        ax.scatter(X[mask, 0], X[mask, 1], c="w", edgecolor=col, marker=".", alpha=0.5)
        if birch_model.n_clusters is None:
            ax.scatter(this_centroid[0], this_centroid[1], marker="+", c="k", s=25)
    ax.set_ylim([-25, 25])
    ax.set_xlim([-25, 25])
    ax.set_autoscaley_on(False)
    ax.set_title("BIRCH %s" % info)

# Compute clustering with MiniBatchKMeans.
mbk = MiniBatchKMeans(
    init="k-means++",
    n_clusters=100,
    batch_size=256 * cpu_count(),
    n_init=10,
    max_no_improvement=10,
    verbose=0,
    random_state=0,
)
t0 = time()
mbk.fit(X)
t_mini_batch = time() - t0
print("Time taken to run MiniBatchKMeans %0.2f seconds" % t_mini_batch)
mbk_means_labels_unique = np.unique(mbk.labels_)

ax = fig.add_subplot(1, 3, 3)
for this_centroid, k, col in zip(mbk.cluster_centers_, range(n_clusters), colors_):
    mask = mbk.labels_ == k
    ax.scatter(X[mask, 0], X[mask, 1], marker=".", c="w", edgecolor=col, alpha=0.5)
    ax.scatter(this_centroid[0], this_centroid[1], marker="+", c="k", s=25)
ax.set_xlim([-25, 25])
ax.set_ylim([-25, 25])
ax.set_title("MiniBatchKMeans")
ax.set_autoscaley_on(False)
plt.show()
Общее время выполнения скрипта: (0 минут 3.357 секунды)


Связанные примеры


© 2007–2026 The scikit-learn developers
Licensed under the 3-clause BSD License.
https://scikit-learn.org/1.9/auto_examples/cluster/plot_birch_vs_minibatchkmeans.html


